Free LinkedIn Analytics Reporting Template
Report your stats both for your Personal LinkedIn Account as well as for your Company Page. This Guide will show you how to do that as well as give you a Free Report to start with.
If you need a LinkedIn reporting template for your personal account or business page, or to manage your clients, you've come to the right place!
You can white label this for your client projects, or use it to create your own.
I'll explain to you how to get the most out of the report.
How To Use The Reporting Template

This can be branded with your logo and/or colors if you'd like, but the format should be pretty pleasing off the bat.
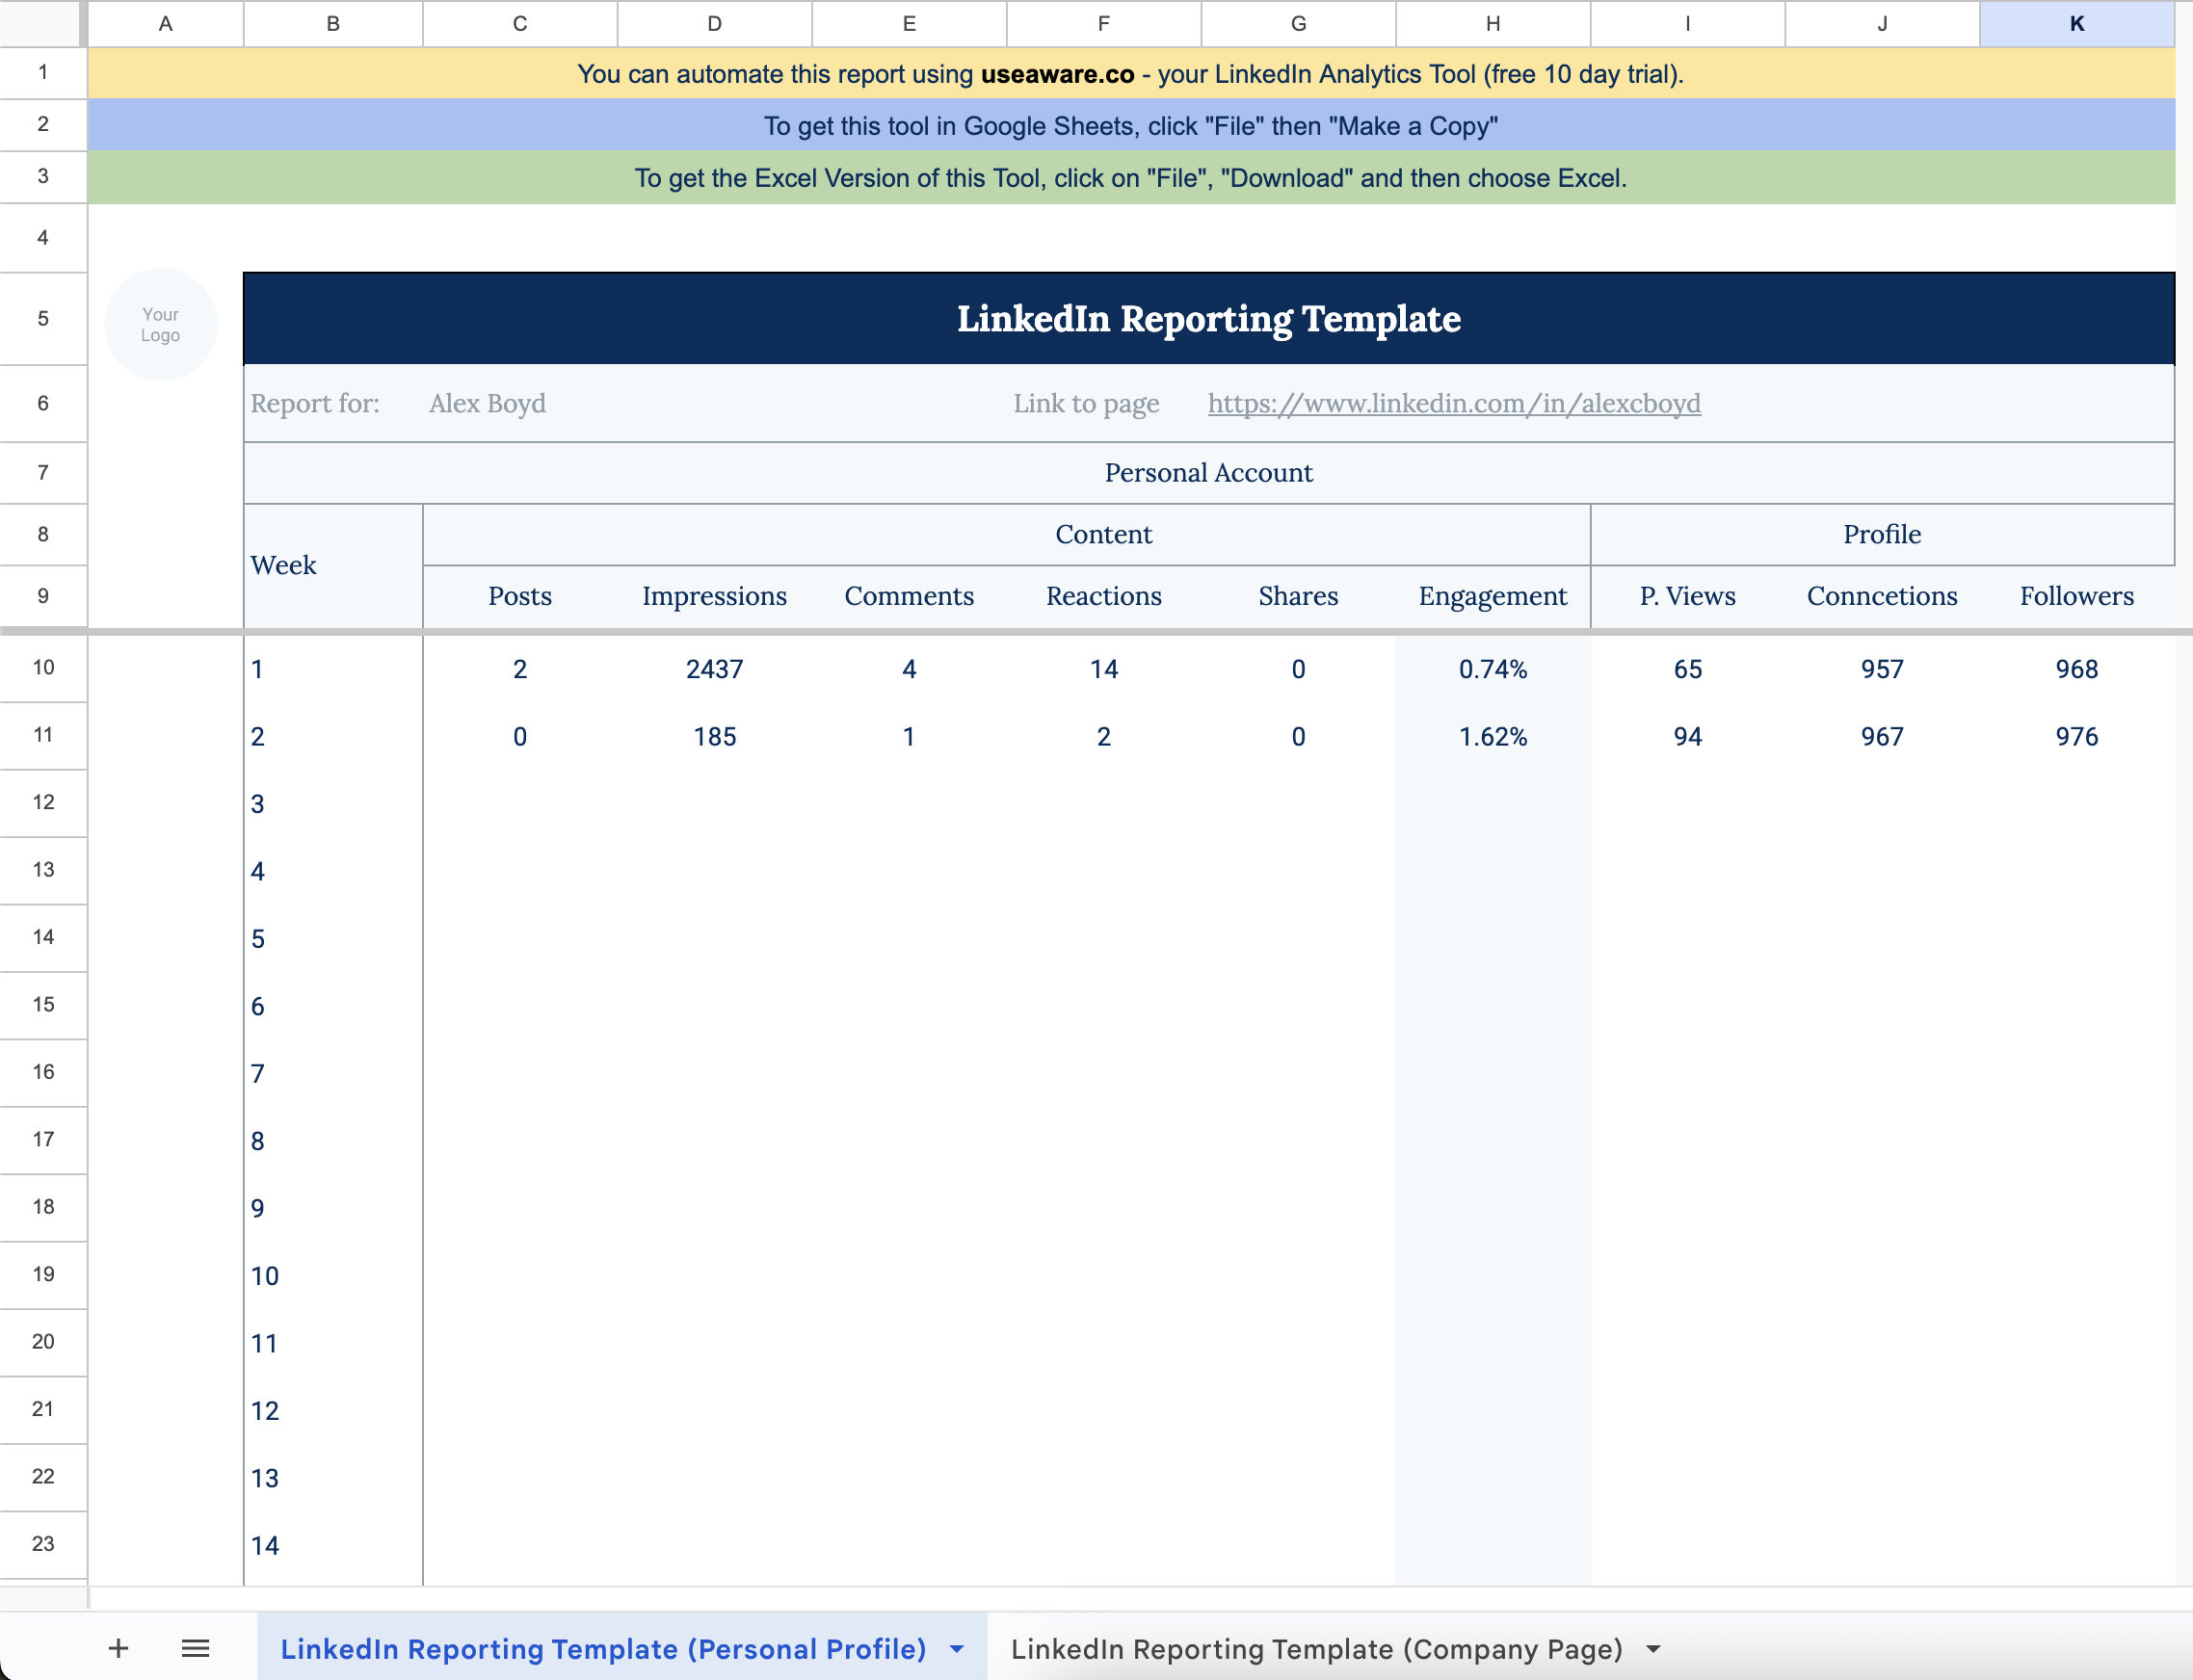
Now, let's have a look at what the dashboard shows:
Personal LinkedIn Account Reporting
In the first tab of the sheet, you will find the template for Personal LinkedIn Accounts. If you are like me and like to monitor your efforts on LinkedIn, this is the place to start.
In the Content section, key in your (or your client's):
- LinkedIn Post Impressions
- The number of Posts published
- Comments on those Posts
- Reactions (such as likes, hearts, and claps)
- The number of Shares (reposts)
Note that the Engagement Rate % of each post is automatically calculated for you. Remember as well that posts are taking longer to experience their full life of engagement and reach in 2025, so you may want to wait 10-14 days before finalizing the stats. If this is annoying (which... it kind of is...!) then you're welcome to use our reporting automation solution for LinkedIn. It includes both company page and personal profile analytics.
In the Profile section, input:
- The number of Profile Views
- Total/Cumulative LinkedIn Connections
- Total/Cumulative Followers
Collecting The Data From LinkedIn
Now, not all of these metrics can easily be found/observed. Let's take for example the Post impressions: are you going to use the number of impressions each post gets as of the post date, or as of the impression date?
The latter is very tricky, and might not be the best representation of how each post is doing, over its own lifetime.
Personal Profile Data Gathering
Get LinkedIn Post Impressions
Do it manually - Hard Way (time-consuming)
You have to manually add together all the impressions of all your posts.
Example: You have 10 written posts, with these impression counts:
2300, 1200, 1100, 4600, 3250, 2300, 2600, 900, 1300, 3400.
Now you add them together the get the overall impression count of your posts.
2300 + 1200 + 1100 + 4600 + 3250 + 2300 + 2600 + 900 + 1300 + 3400 = 22950
This total count you will now keep until the next week to (eg. Monday) to compare it to next week's results.
This time you will do exactly the same thing. Maybe this time you have instead of 10 Posts, 12 Posts. So will have to count and add all of them together again.
Let's say you have now a total of 25400.
The discrepancy of this week vs next week would be 2450 impressions.
This is what you want to report in your sheet (I said it's hard).
Remember: To get accurate data you have to do this on the same day of the week at approximately the same time every week!
Automatically Report - Easy Way (no time needed)
After this messy start, I want to show you the easy way to handle this topic.
Get yourself an Aware Account and set your date range to Weekly, or Last 7 Days, or whatever reporting date you're looking for. This automates the process of telling you what content is doing the best, with pretty graphs you can share with your client.
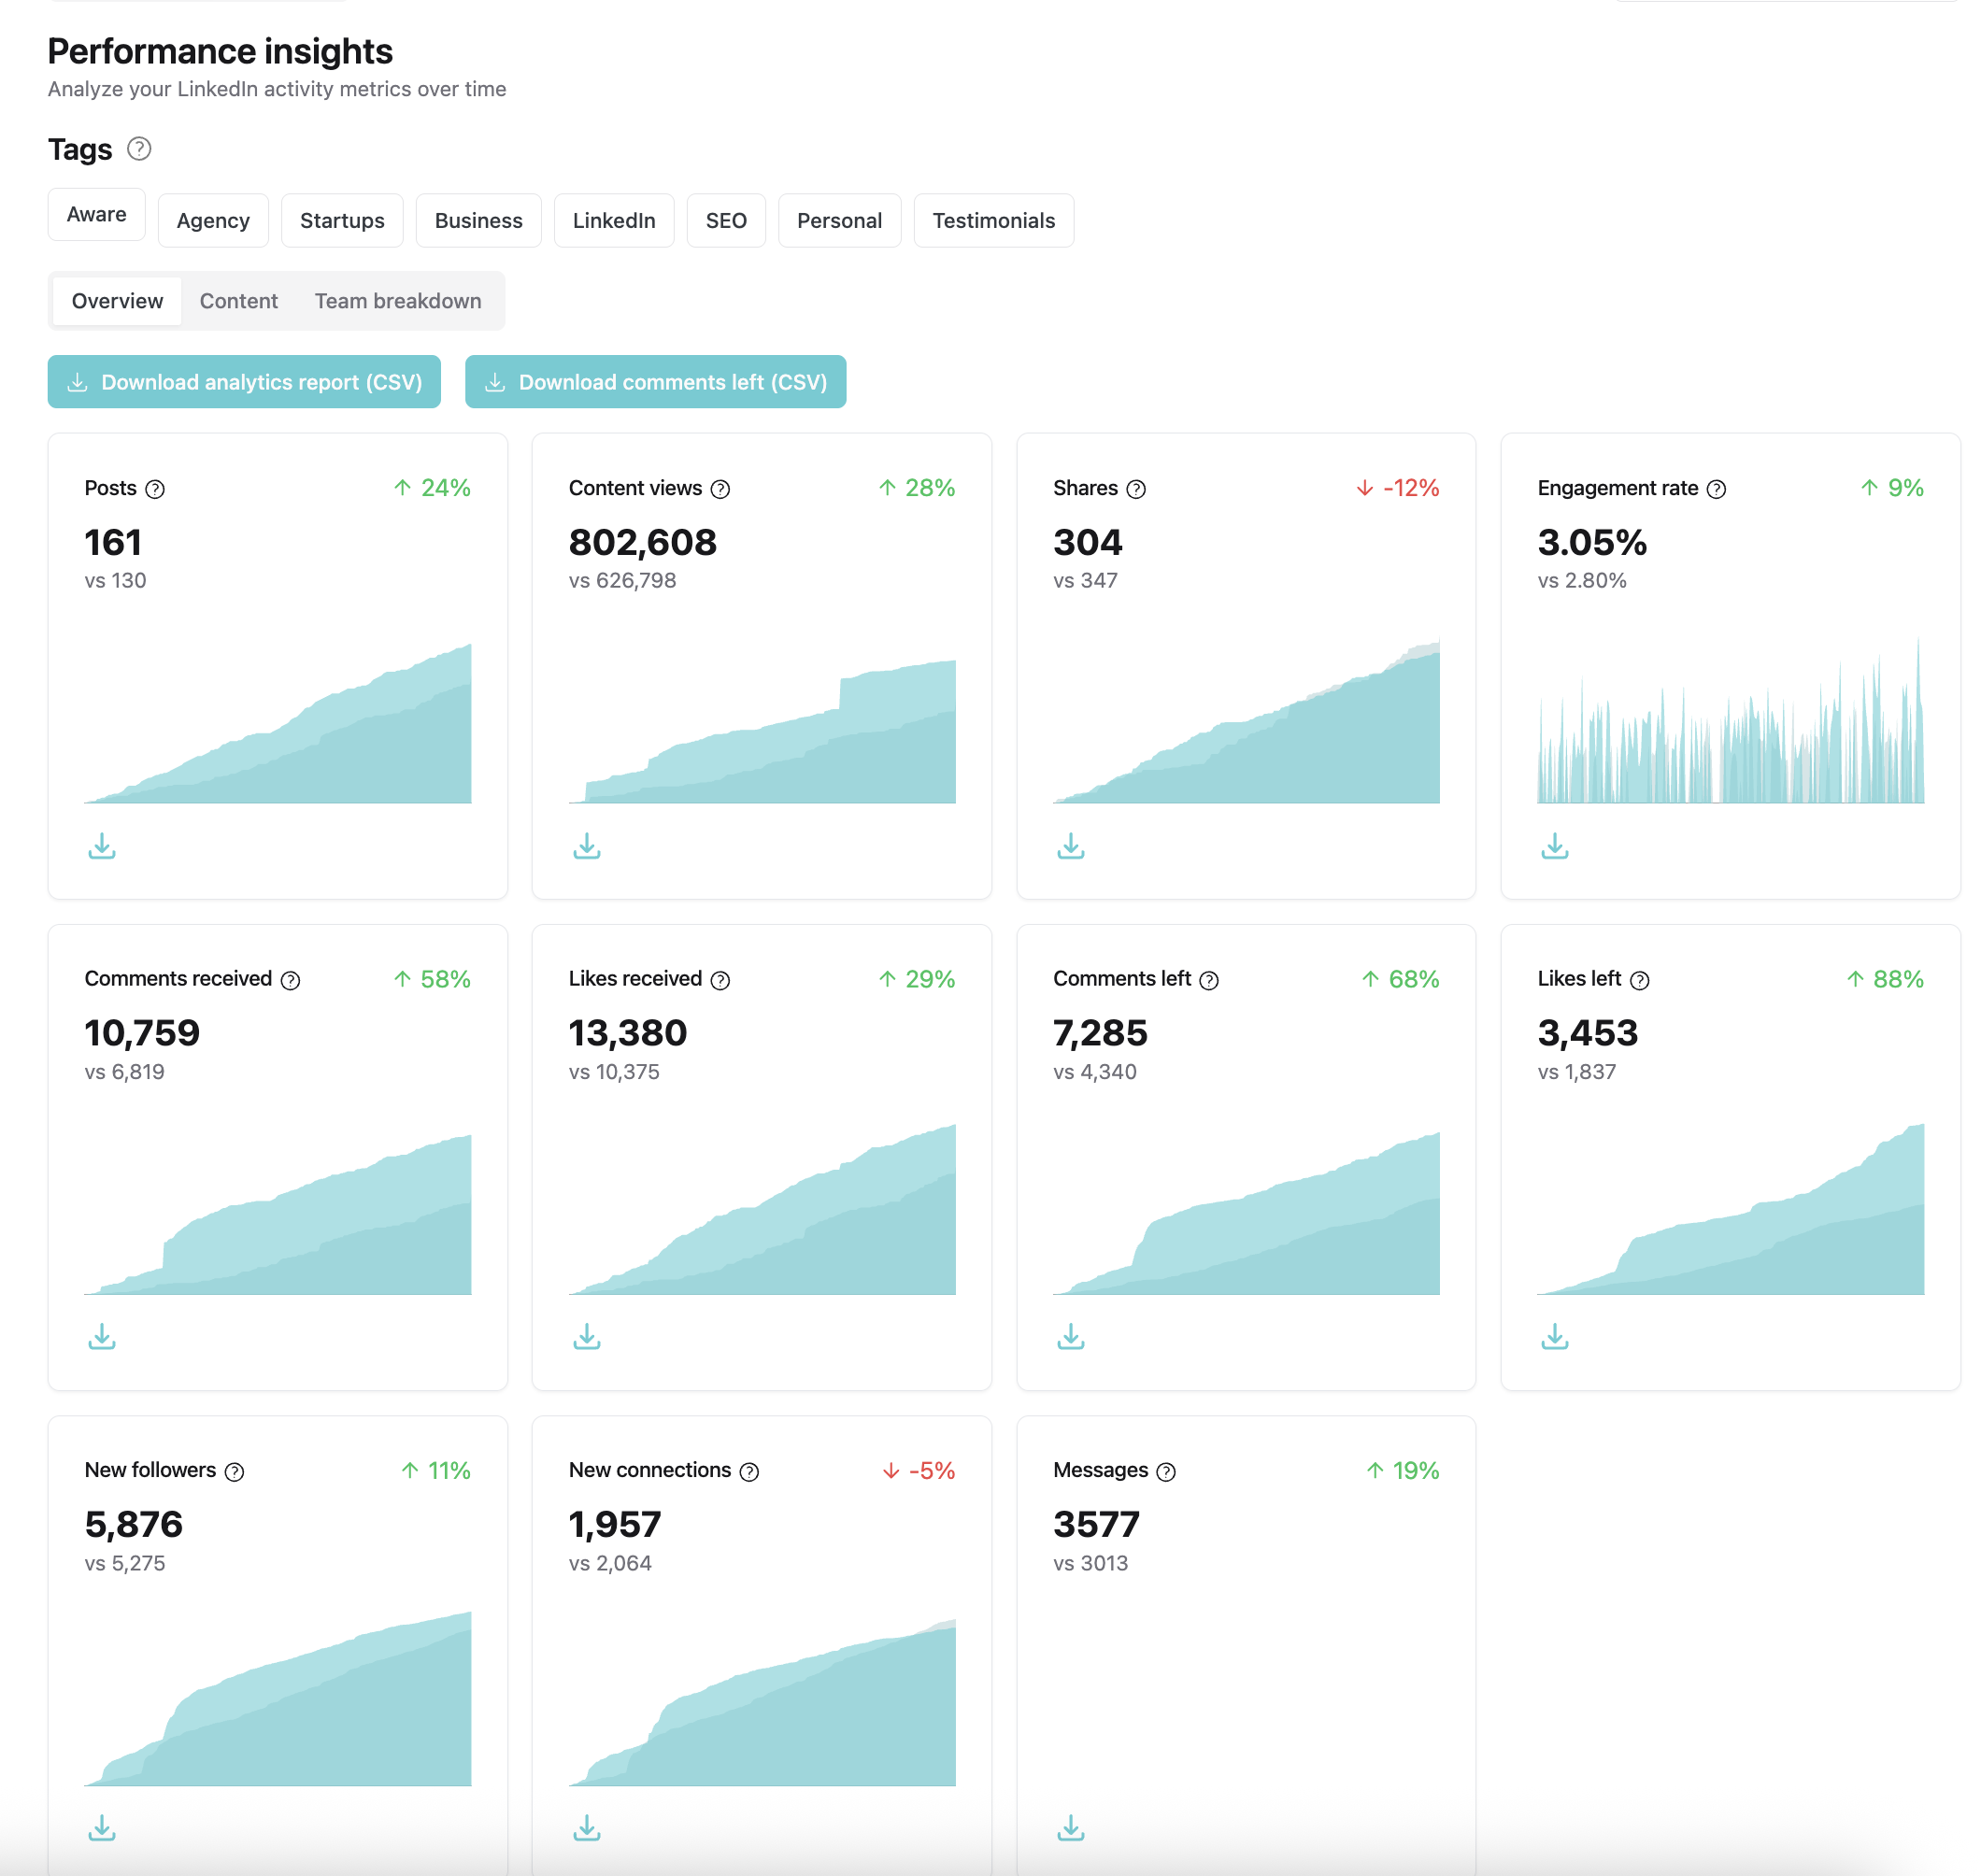
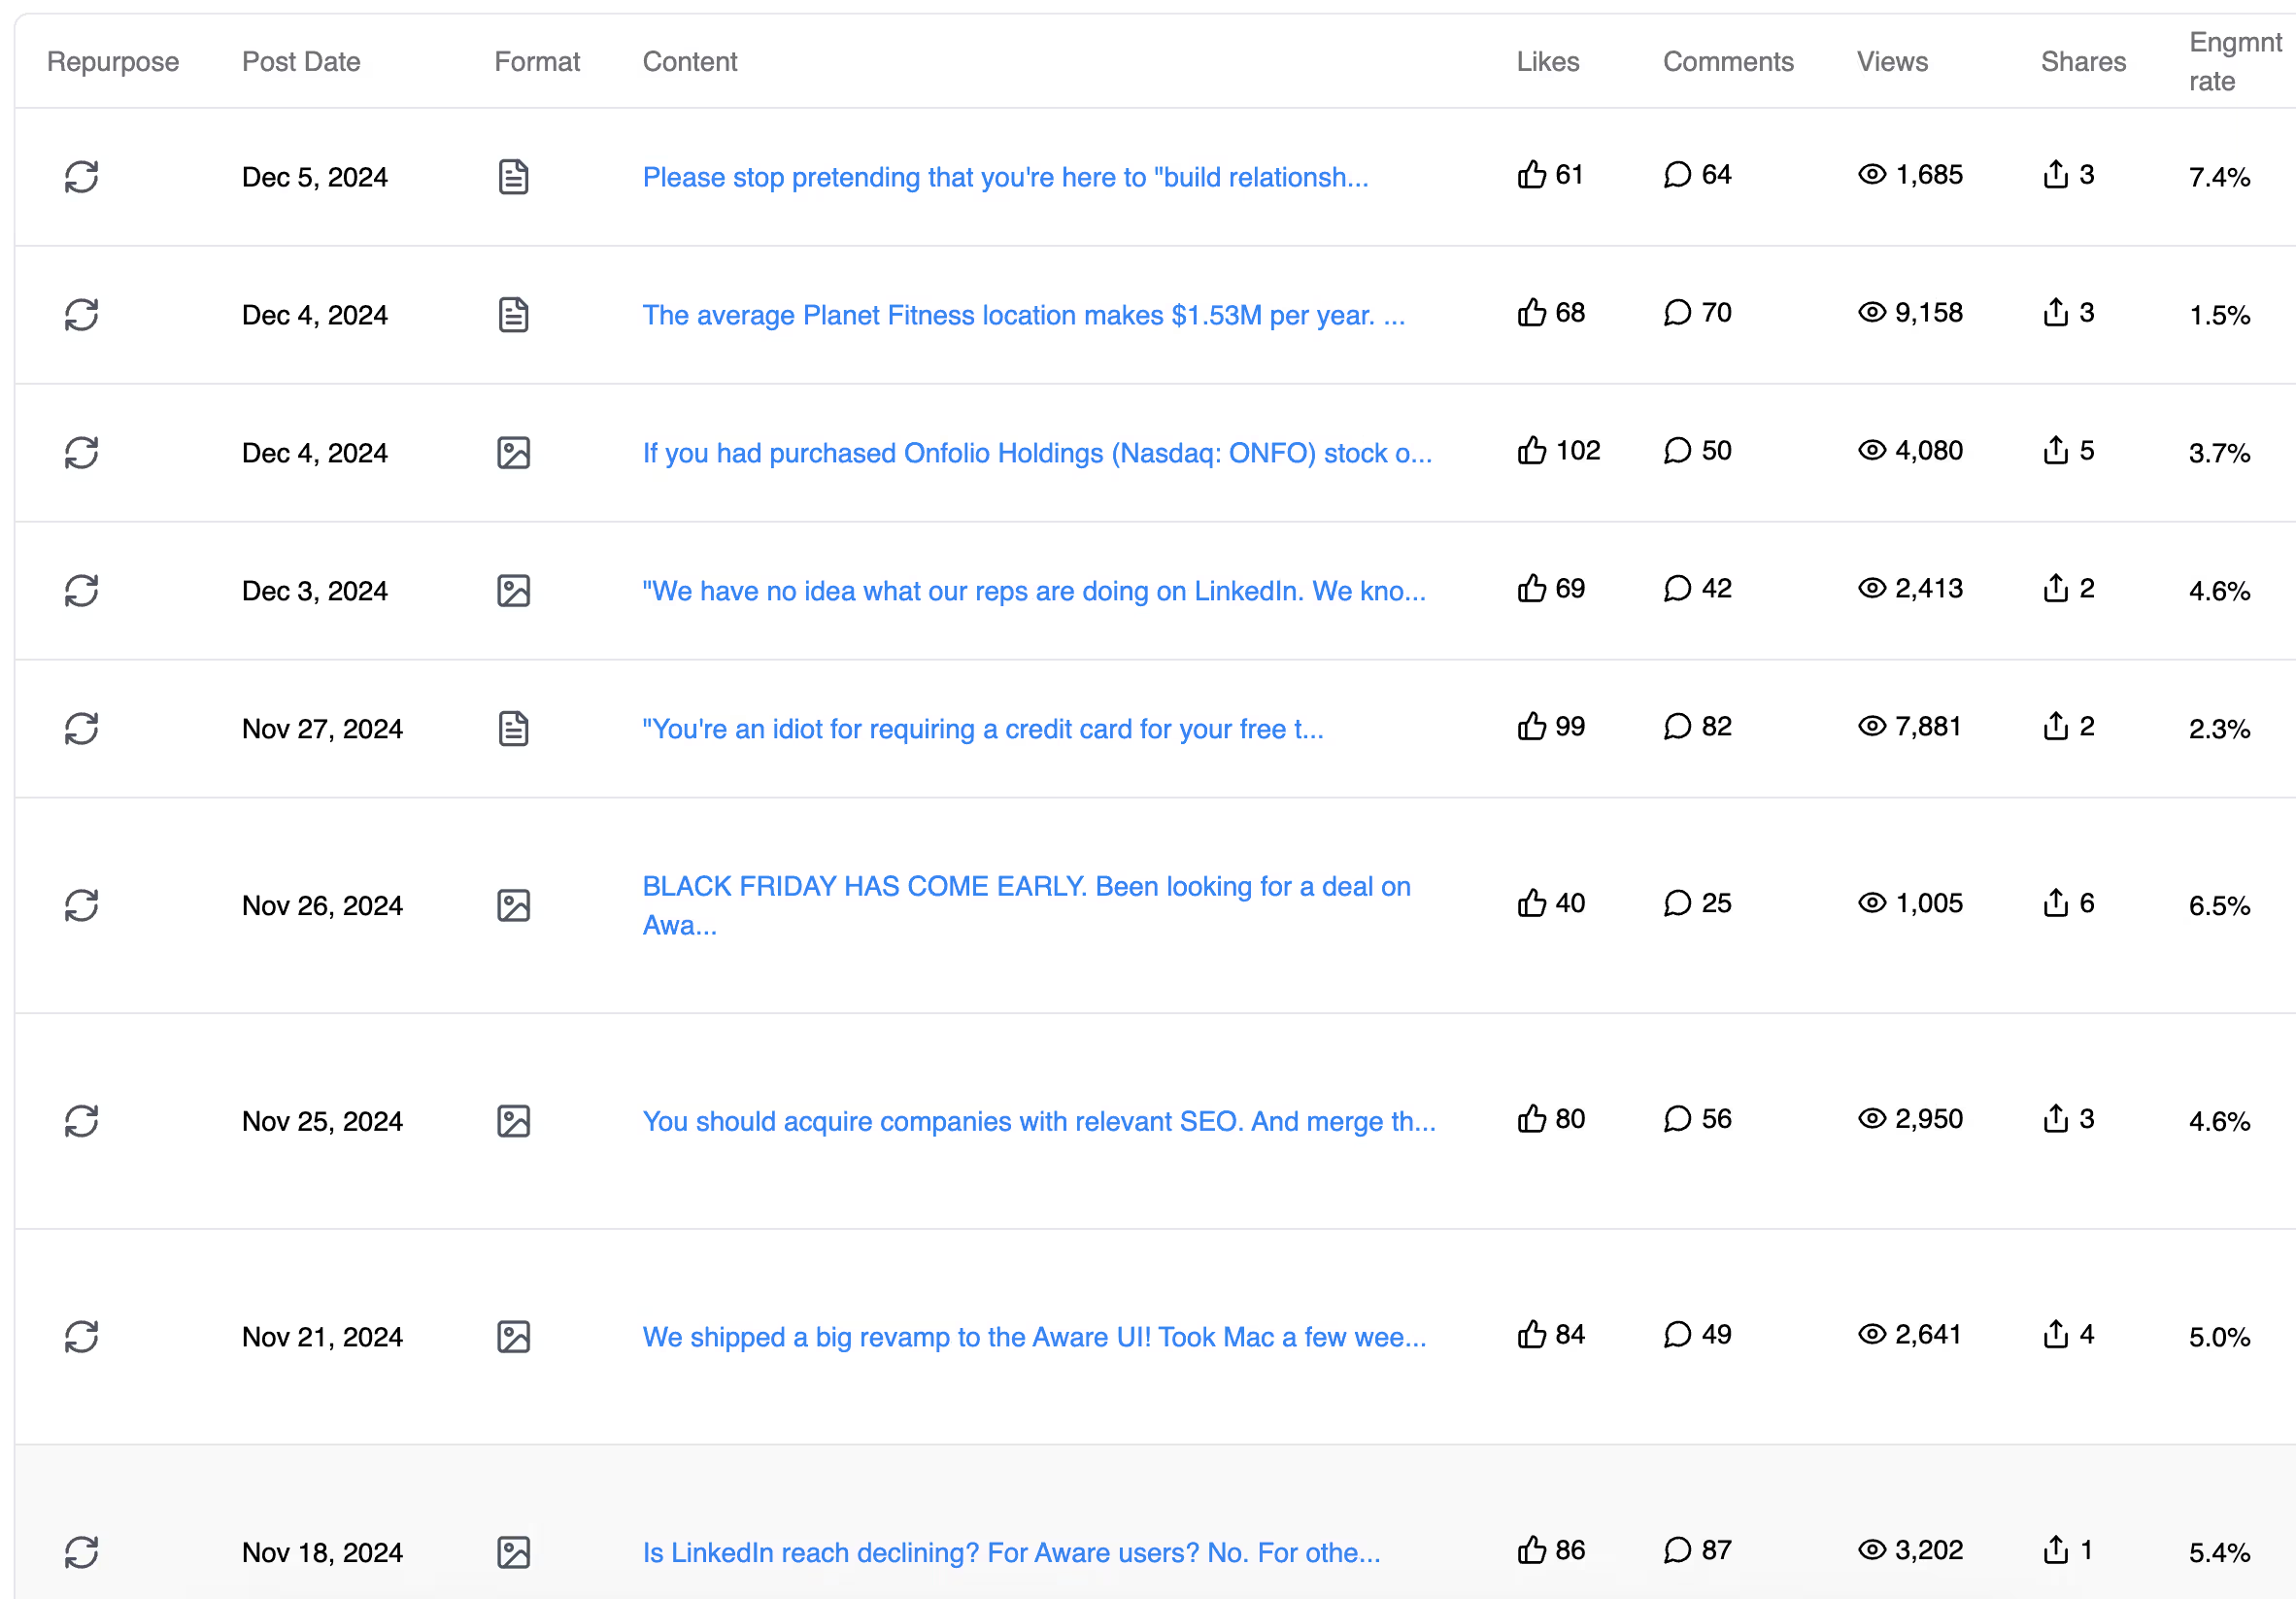
Further, you can get all the post detailed stats like:
- Correlation between Post Reach and Comments or Reactions
- People viewing your content by Job and Company
- The Location from which people viewed your content
- The Engagement Rate % and more
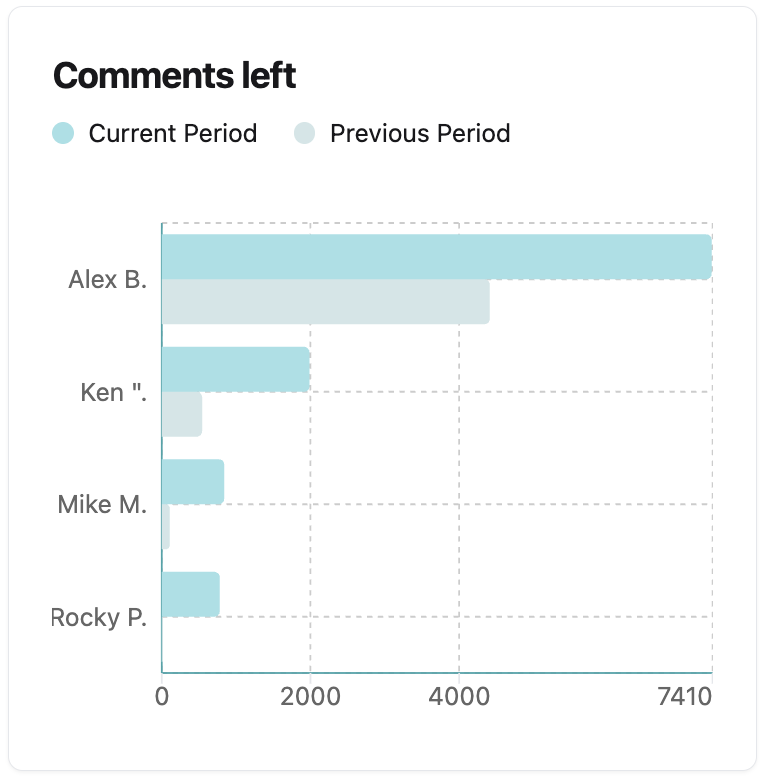
As well as performance across your team:

Get The Number Of Comments
Here the same principles as for impressions apply: If you want to obtain precise numbers of comments left in that week, you have to calculate each week the number of total comments and then subtract it from the next week's value.
This is much easier to do, and more accurate, if you use a cohort analysis; it just requires potentially going back and increasing prior week's numbers. We recommend inputting the number of comments each post gets, in a table, and then summing up that table, rather than trying to keep track of net new comments received each week, if you're going to do this by hand.
With Aware, of course, this is done automatically and you can review the data in either format.
Get The Amount Of Reactions
This is the same as getting the number of comments, except that you can't get the date of a reaction, on LinkedIn, so you're forced to use the cohort system, which we recommend anyway.
As a refresher, this is when you look at each post's performance, then sum up the performance of all posts in a date range, rather than trying to look at exactly how many reactions were received on any post, in a given time frame, which is all but impossible to do.
Get The Amount Of LinkedIn Shares
Now it gets a little more interesting. Shares are not observable with your LinkedIn stats. You have to count them when they occur.
That means you will get a notification as soon as someone shares your Post... usually. LinkedIn doesn't always give it to you. But this information can be used to fill out the sheet.
Again, with Aware this process happens completely automatically - no need to do anything.
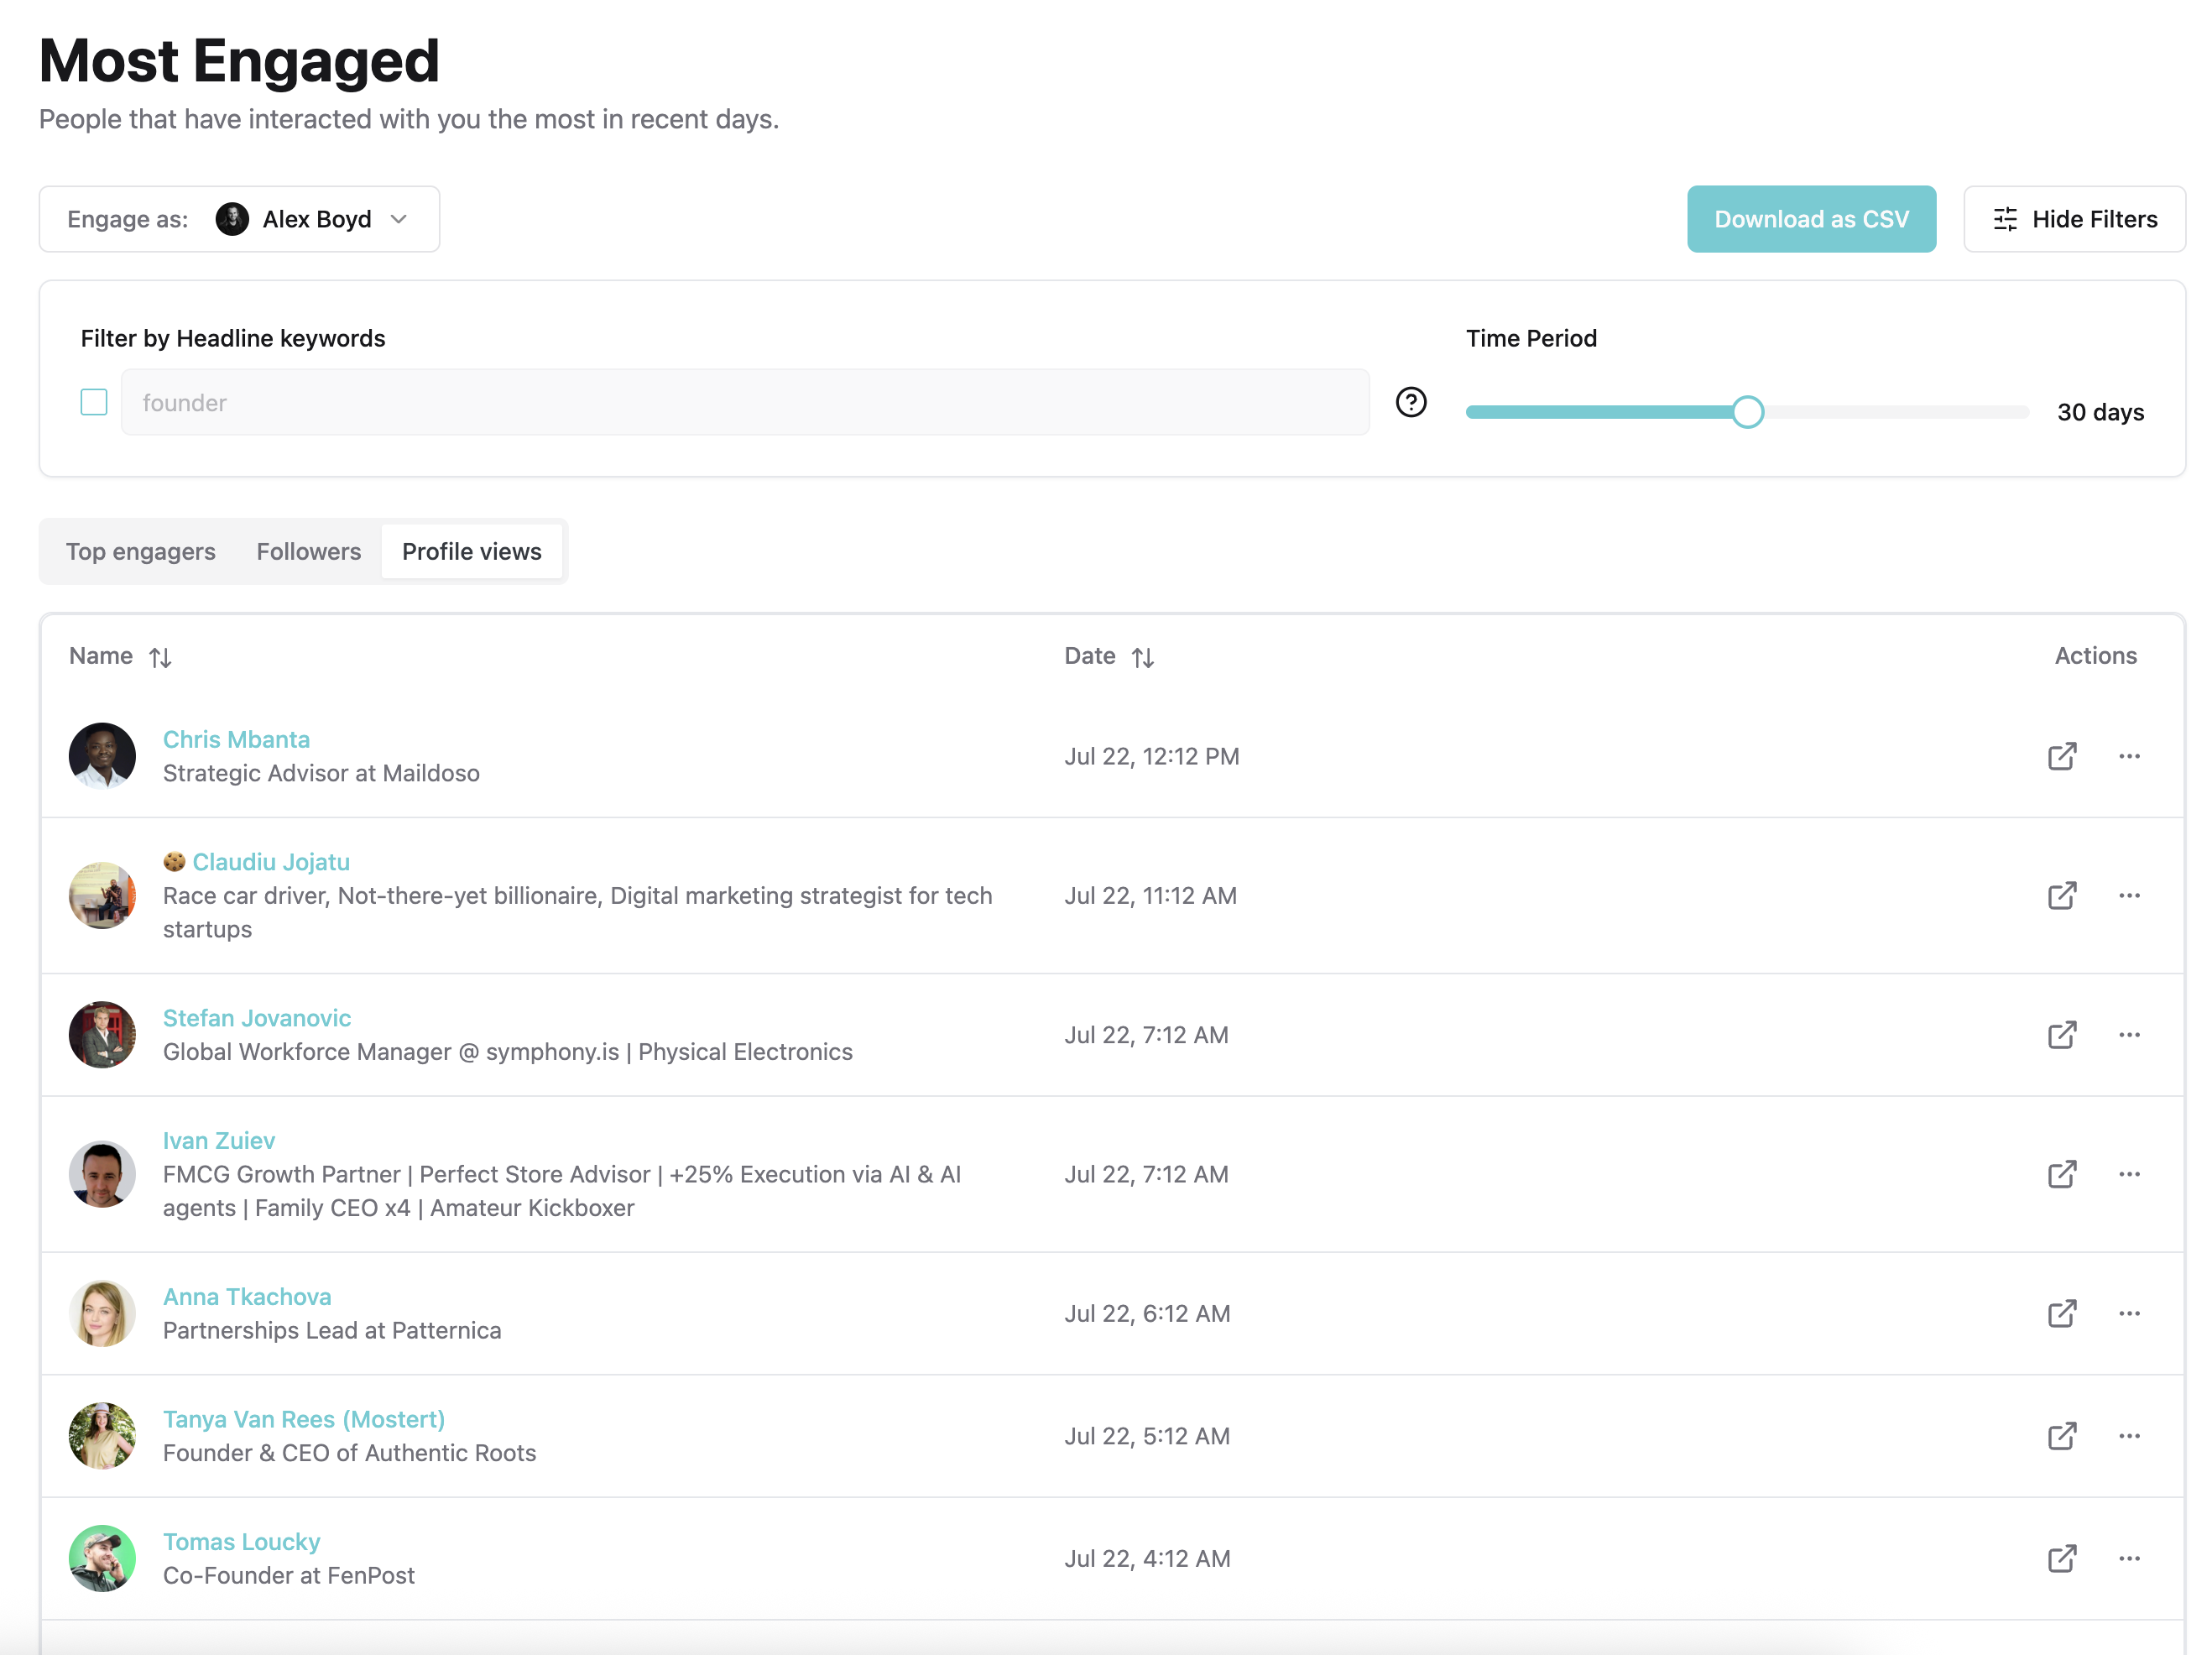
Get The Amount Of Profile Views
This one is fairly simple yet a little tricky. You have to go to this page on LinkedIn and total them up. Note that, in Aware, there is a handy filterable and downloadable list for this info!
Get The Amount Of Connections
Very easy to do. Just open the tab "My Network" and you will see the total amount on the top left side.
See Your Followers On LinkedIn
A little harder to find are your followers. You have to open this page to see the amount of current followers for your account. Just copy and past it into our white labelable template.
----
Done! This is how you fill in your Personal LinkedIn Content data into the template. By the way, we have another article if you'd like to dig more into this, that just talks about LinkedIn metrics and KPIs.
Now let's move on to the Business Pages.
Business Pages
For the Business Page Report much is the same as for the Personal Report. The only difference is that it's easier to observe the data from LinkedIn.
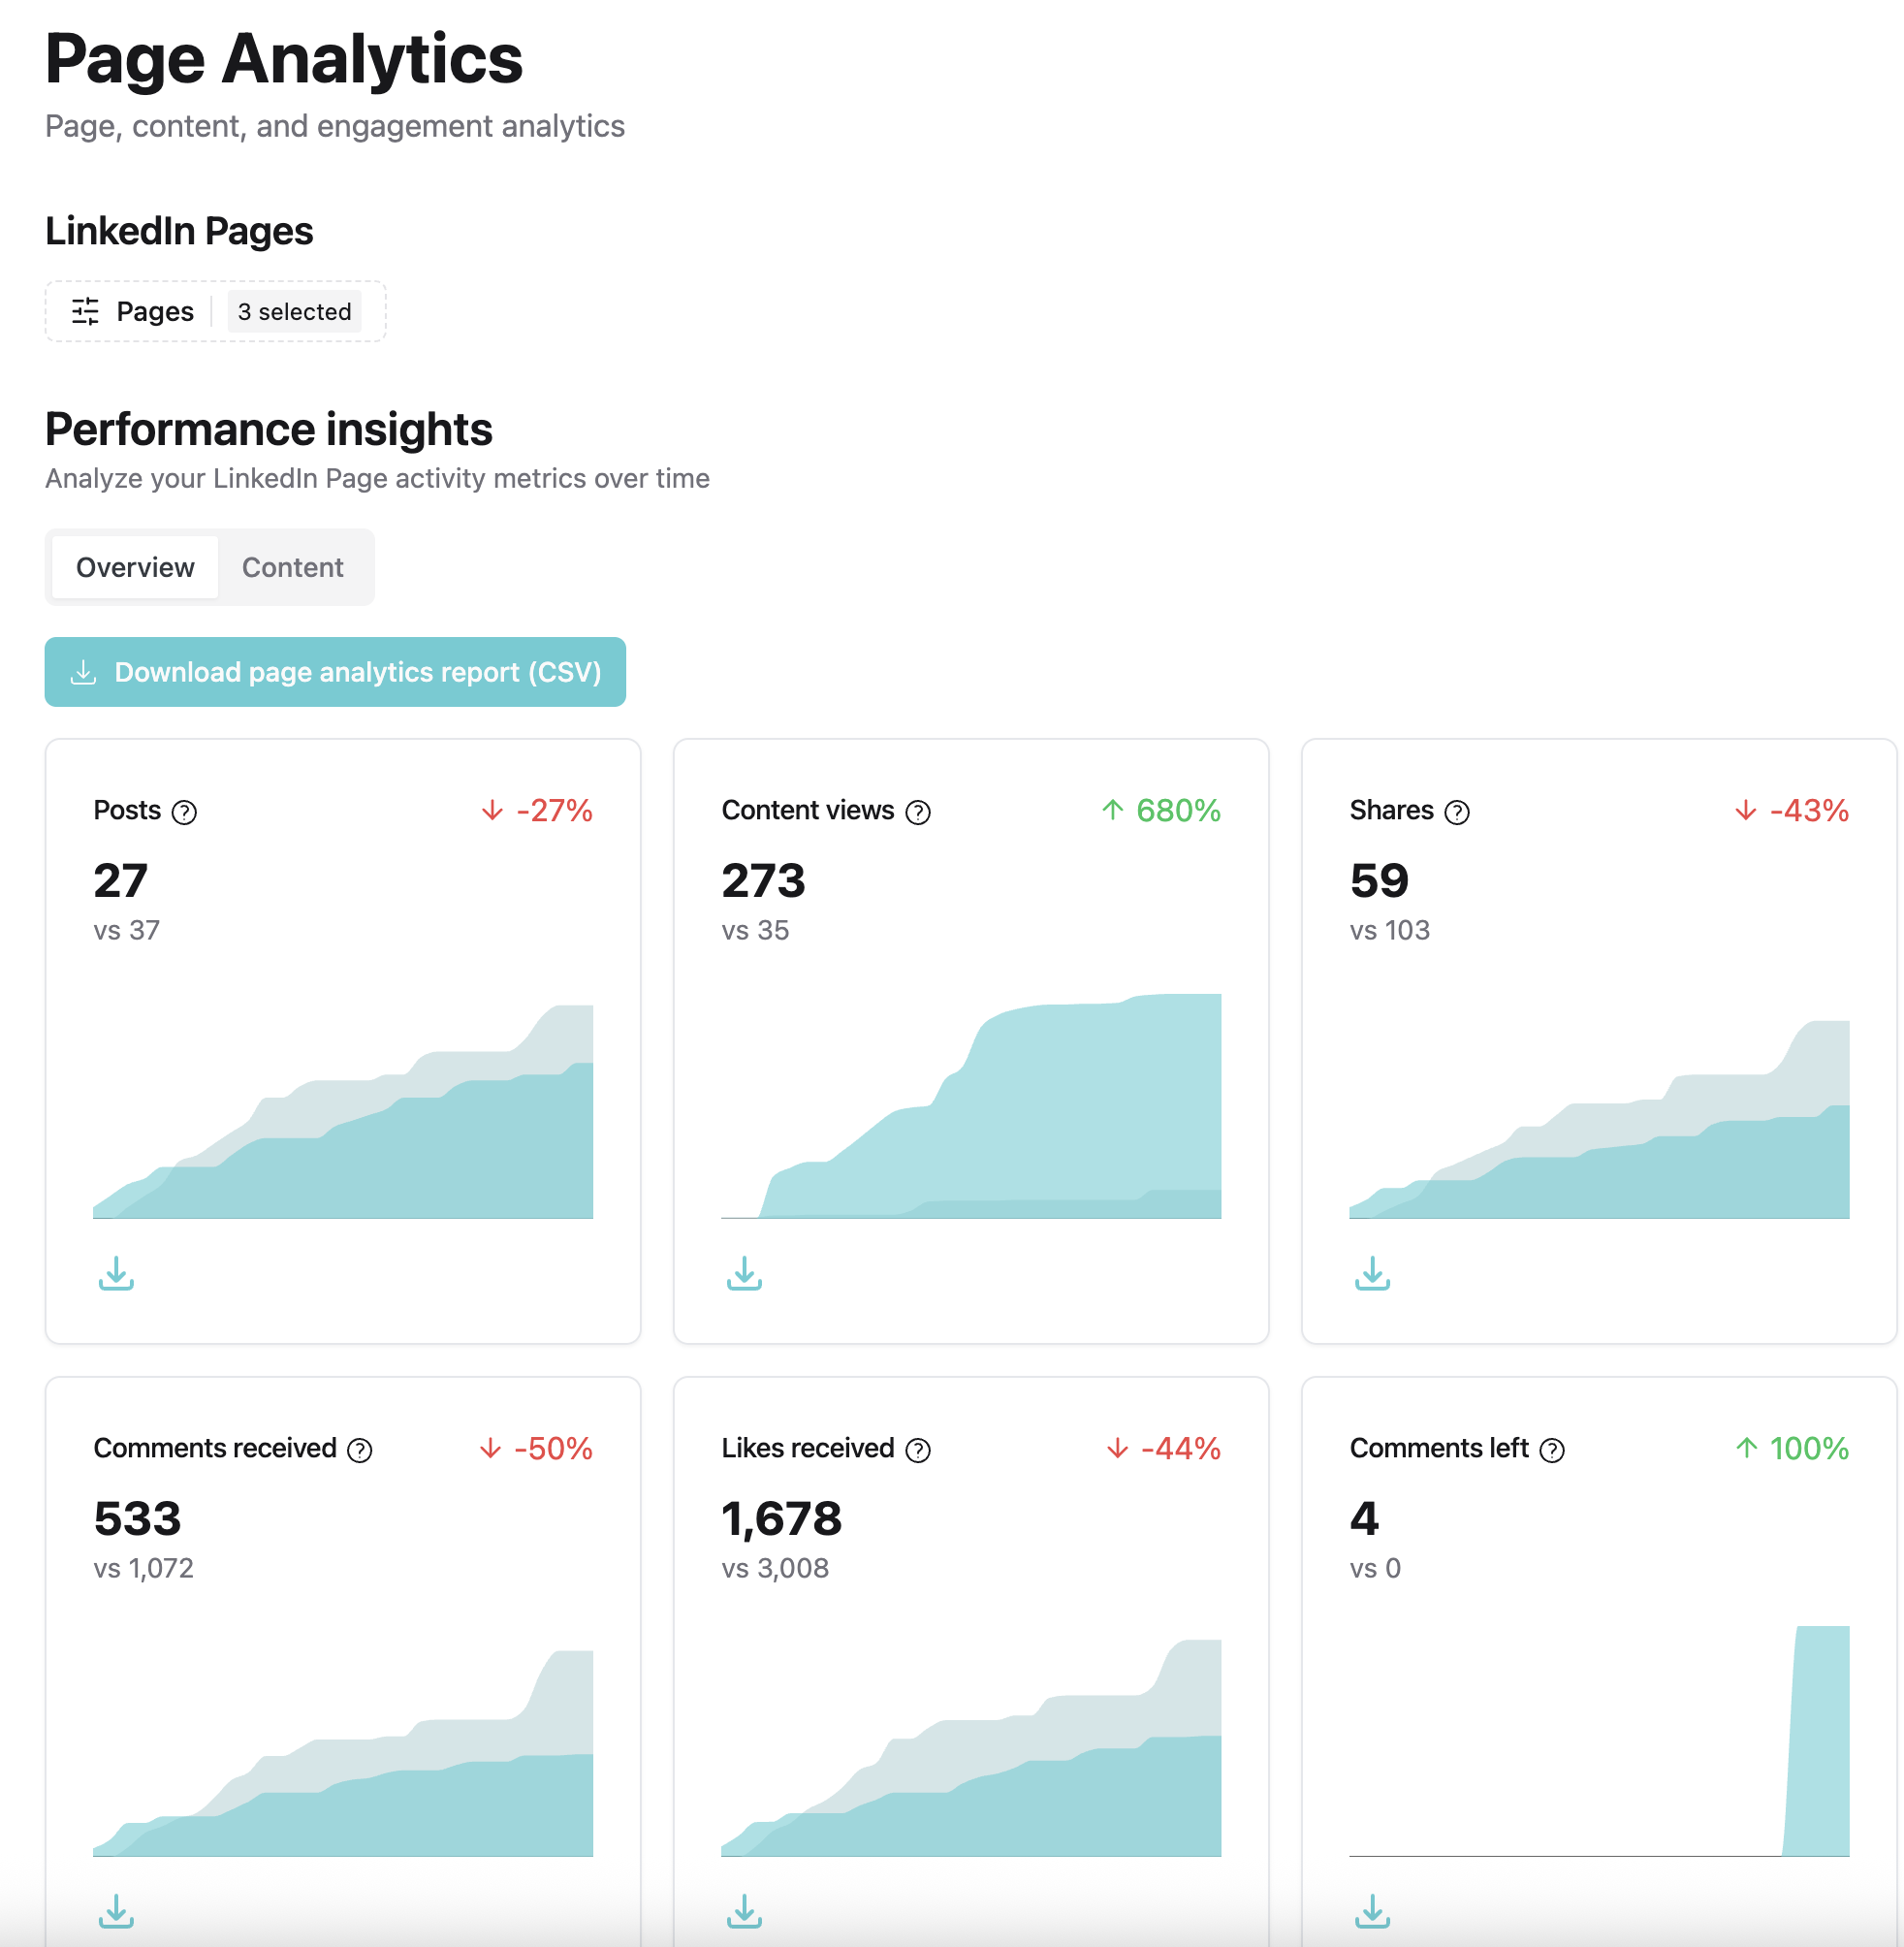
LinkedIn will give you more detailed insights into your content performance when you have a company page.
To open your insights click on your company page and open the Analytics Report Tab in the top Nav-bar.
When you have the detailed Analytics report opened you can switch the time range as shown below

Now, I'm not going to tell you how to extract each individual metric again, since I believe it's quite obvious at that point. Just copy and paste what you see within your template.
Alway's remember to set the right time range first 🙂
Last But Not Least: An Alternative To This Report

You expected this, right? Us pitching Aware right here right now. And you'd be right. Well, we build this tool exactly for this purpose so you can save yourself time analyzing your LinkedIn content.
You can also analyze your Company Pages, too!
I invite you to join us and try it out for yourself. We have a Free Trial, too.
Our goal is that you do not have to spend a whole lot of time figuring out what works for you.
Instead, we want you to get actionable insights in form of statements that we can give you based on your data and the benchmarking data of your industry peers. Stay tuned for a product update about how we find insights you would normally overlook!
Give it a go and start a free trial of Aware! Choose the most basic plan, if you only need analytics and you don't need the engagement feeds capability.

Frequently Asked Questions
About The Engagement Rate
Is The Analytics Report Really Free?

Sure it its. Even do we provide an automated version of this report (called inlytics) you can still use the template provided for free. You can also use it to brand it with your own content.
Can I Export The Template To Excel?
Yes you can. The "tool" itself is build in Google Sheets but it's no problem to export it to Excel by the click of a button. You have to click on "File", then "Download" and then simply choose Excel. That's it.
Can I Automate The Process Of Filling In The Dashboard With Data?
This template can't be automatically filled - at least it's not intended for this purpose. BUT: inlytics (our tool) can and will do that automatically for you. If you are looking for an LinkedIn Analytics Tool to get always up-to-date data with Team and sharing abilities I recommend checking it out.
Where To Download The LinkedIn Reporting Template?
There you go buddy: https://docs.google.com/spreadsheets/d/15yuMsKozvbwGOWtnLpcYW7BFis1iyDfvQ5Y1pCFe-yk/edit?usp=sharing